Ed Baker FLS ARCS

Picture of Ed Baker.

Interdisciplinary researcher using sensor networks and acoustics to monitor biodiversity and environments.

GitHub | CV | Media | Social

Latest publications

All publications

Google Scholar

Co-authorship Cloud

Latest blog posts

All blog posts

Talks

All talks

Notes

All notes

Some thoughts on

Acoustic figures

Acoustic figures and diagrams using R.

Wave in air

Represenatation of a pressure wave in air created using the R package figuRed

This is created by the wave_particle() function of FigurEd.

Wave sampling

Sampling a wave

Figure showing how a waveform is sampled digitally.

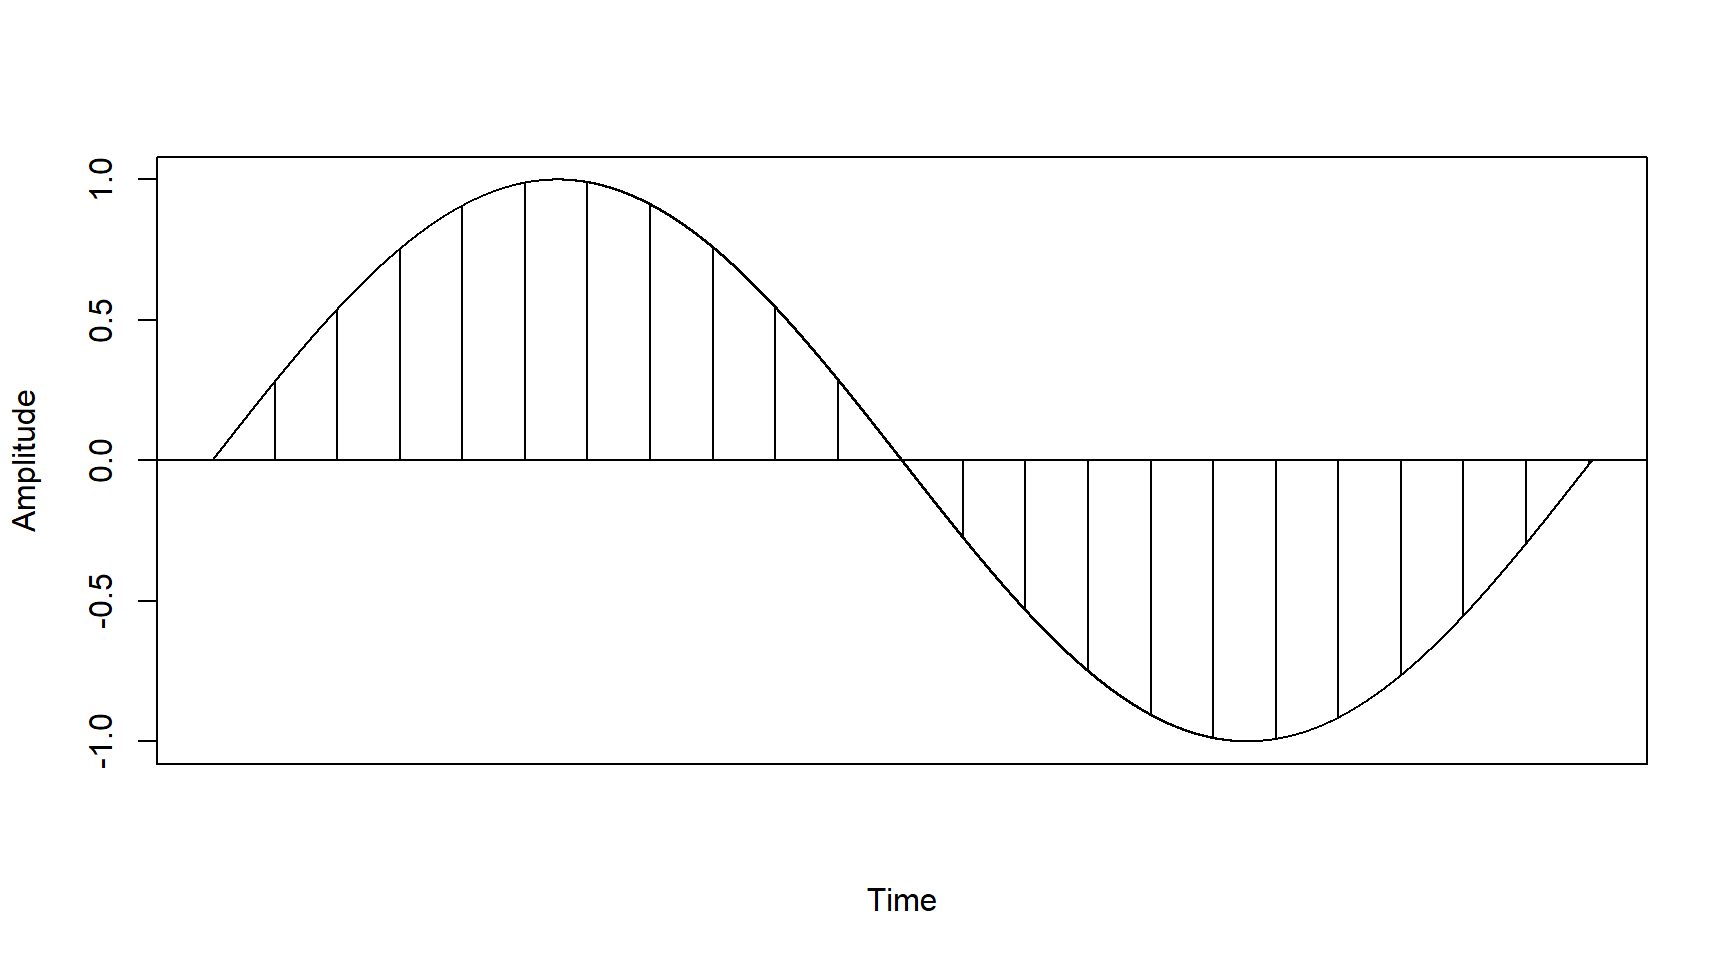
This is created by the waveSampled() function of FigurEd.

library(figuREd)
library(tuneR)
waveSampling(sine(freq=1), 2000)

A sampled wave

A sampled waveform.
library(figuREd)
library(tuneR)
par(mfrow=c(2,1))
waveSampled(sine(freq=1), 1000, 10)
waveSampled(sine(freq=1), 1000, 50)